Data on Voting in Rhode Island
Most RI elections are decided in the Primaries
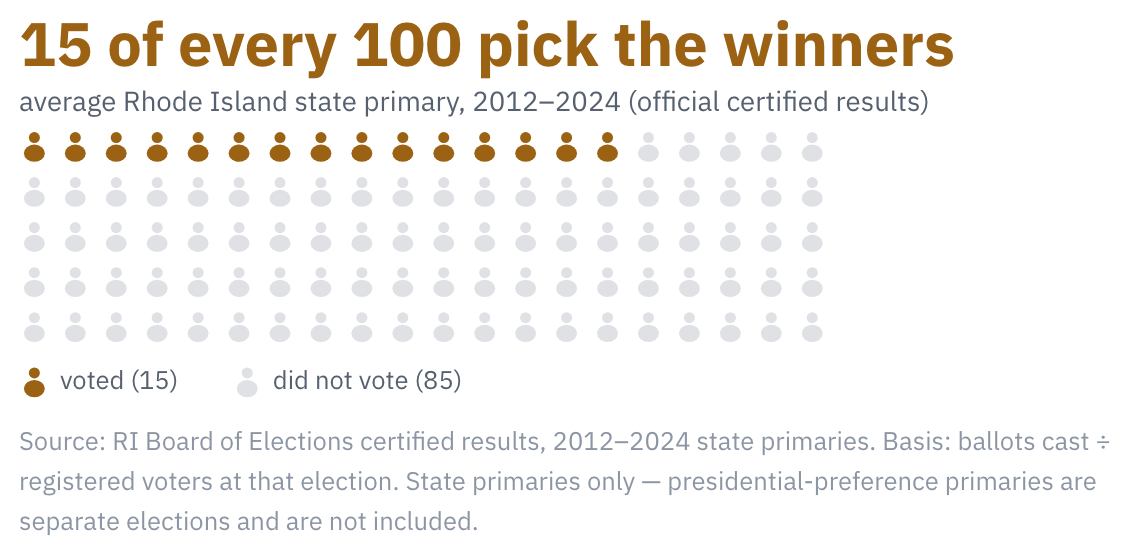
About 85% of registered voters skip the state primary.
Across the last seven state primaries (2012–2024), turnout averaged 15.1% of registered voters. That means about 85% sat out the elections that often decide who wins the seat.
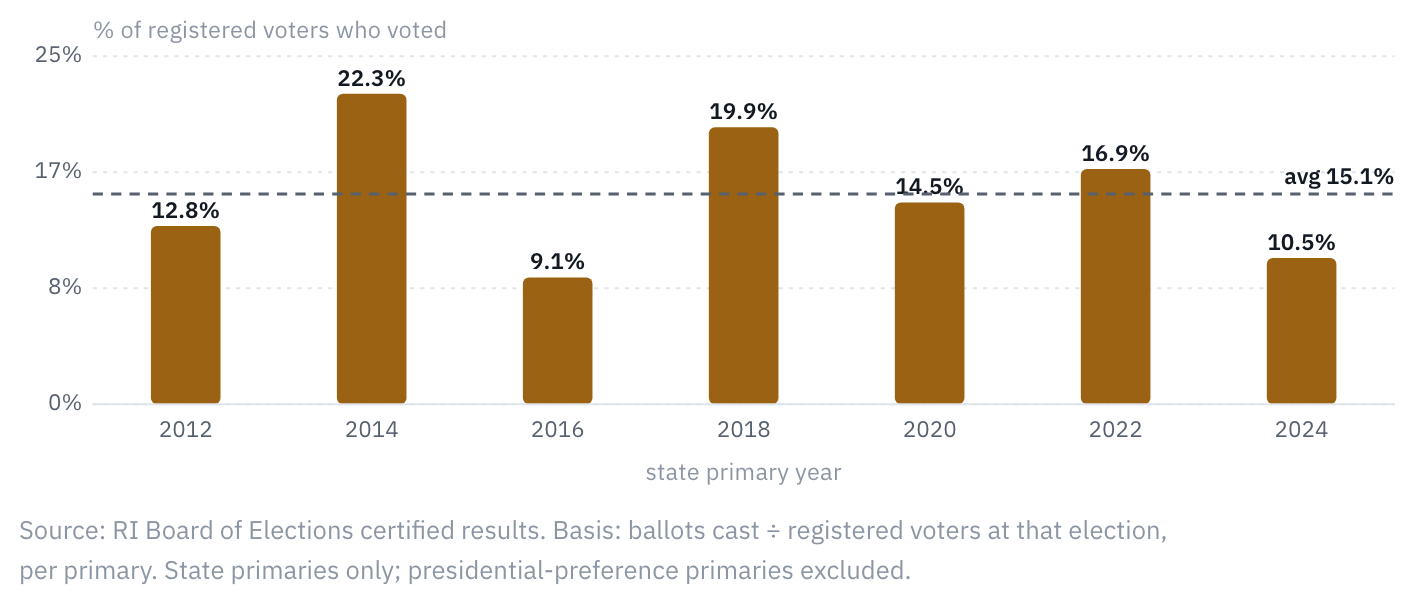
Primary turnout has been low for over a decade — a little higher in governor years, lower in presidential years.
Cycle by cycle, turnout ran from 9.1% (2016) to 22.3% (2014). Governor-year primaries (2014, 2018, 2022) draw more voters; presidential-year primaries draw fewer.
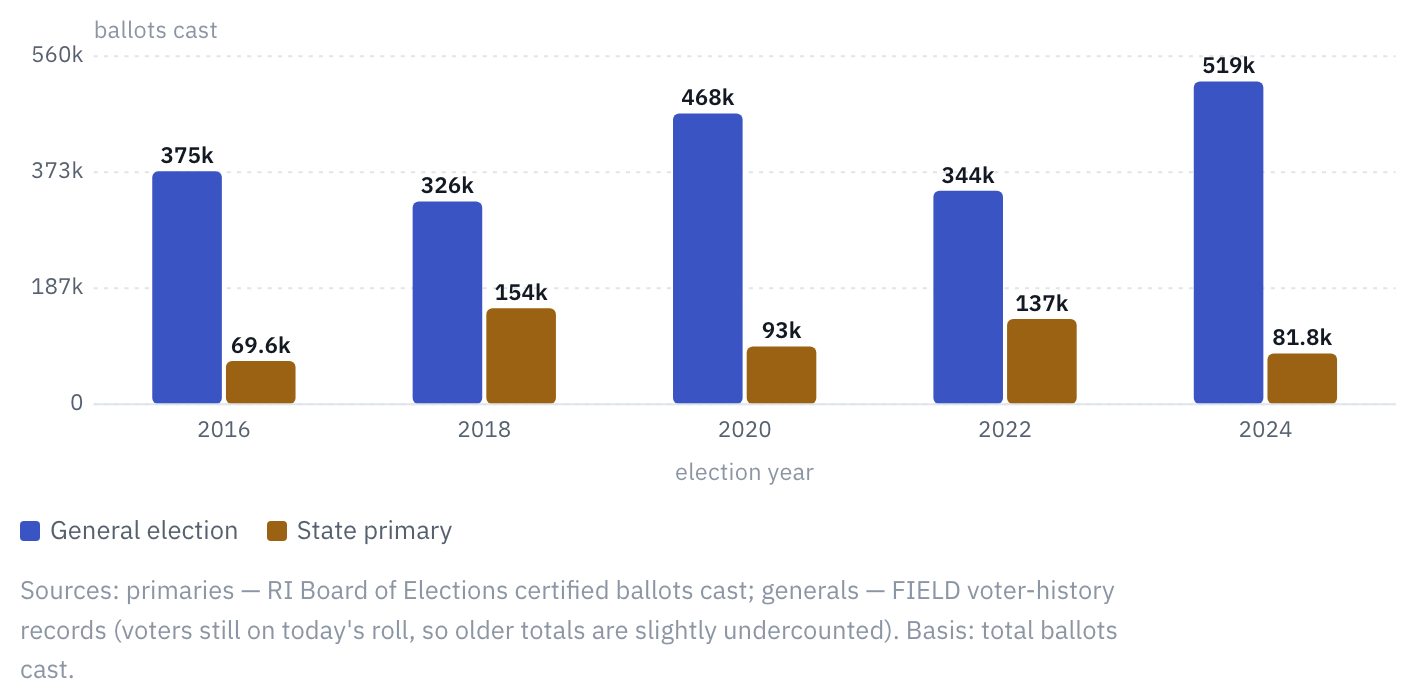
In a presidential year, the November election draws five to six times as many voters as the state primary — and even in the biggest primary years it draws more than twice as many.
In 2024, about 519,000 people voted in the general election. Only 82,000 voted in the state primary. In seats where one party dominates, the small primary electorate effectively picks the winner.
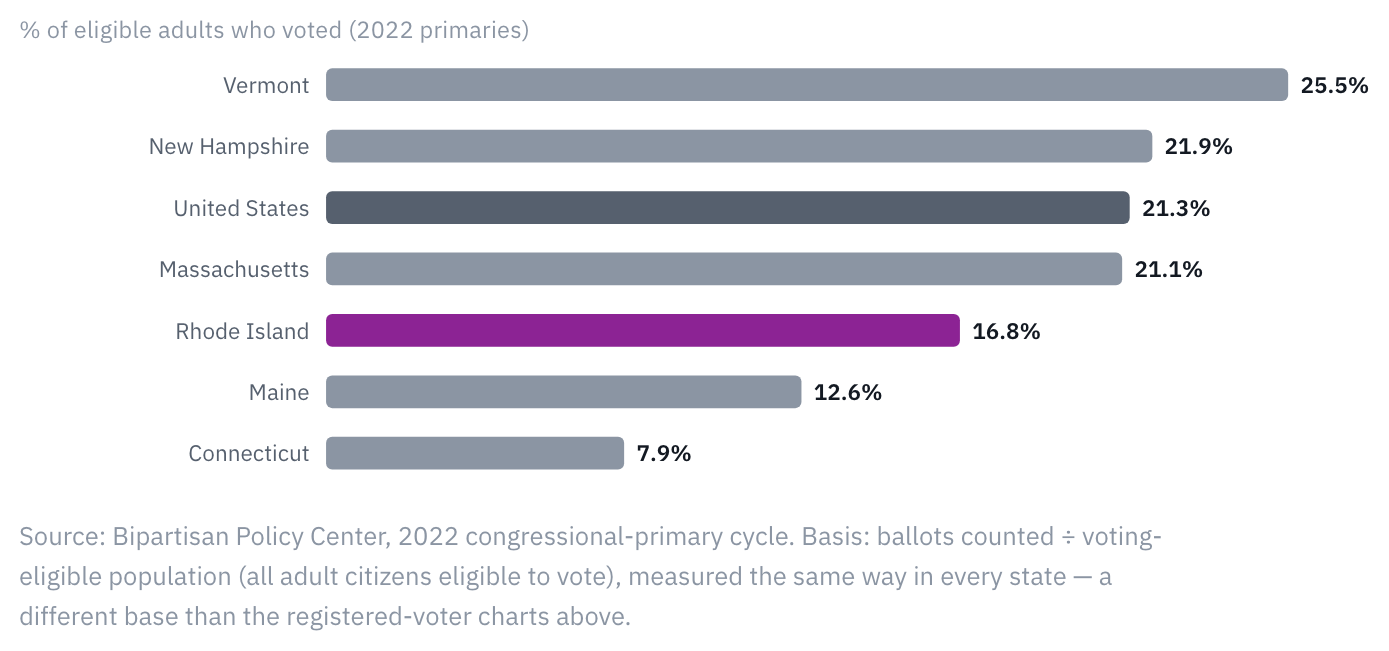
Rhode Island's primary turnout is well below the national average.
In the 2022 congressional primaries — the most recent cycle measured the same way in every state — 16.8% of Rhode Island's eligible adults voted, against a national average of 21.3%.
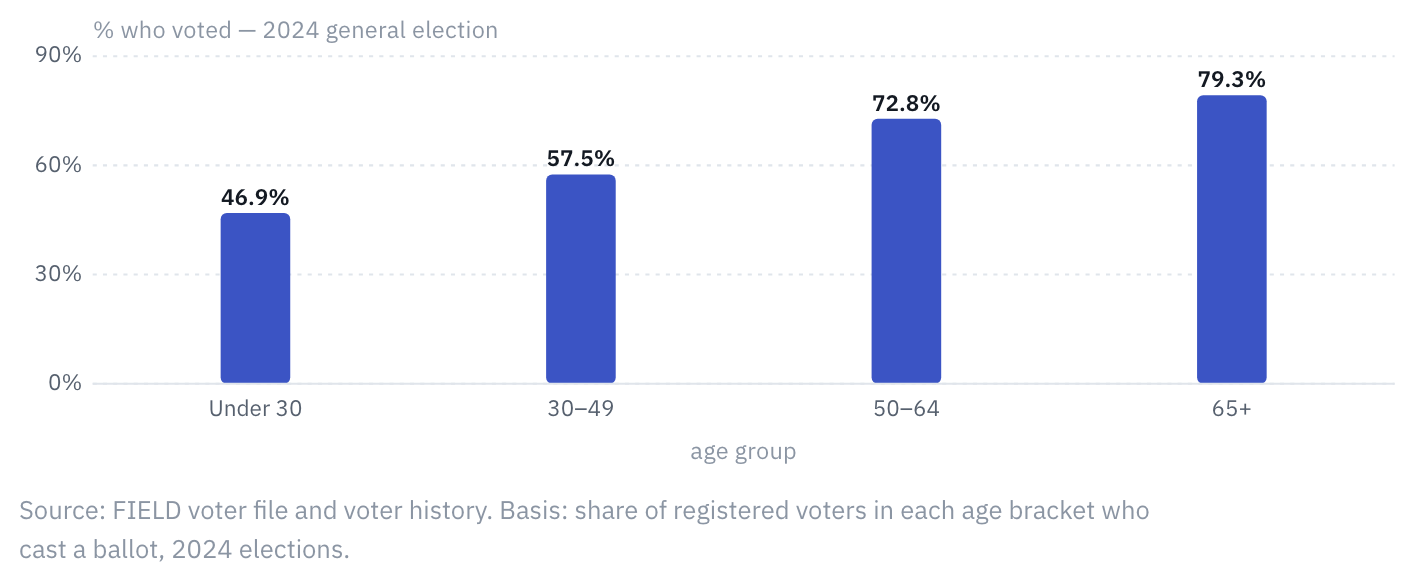
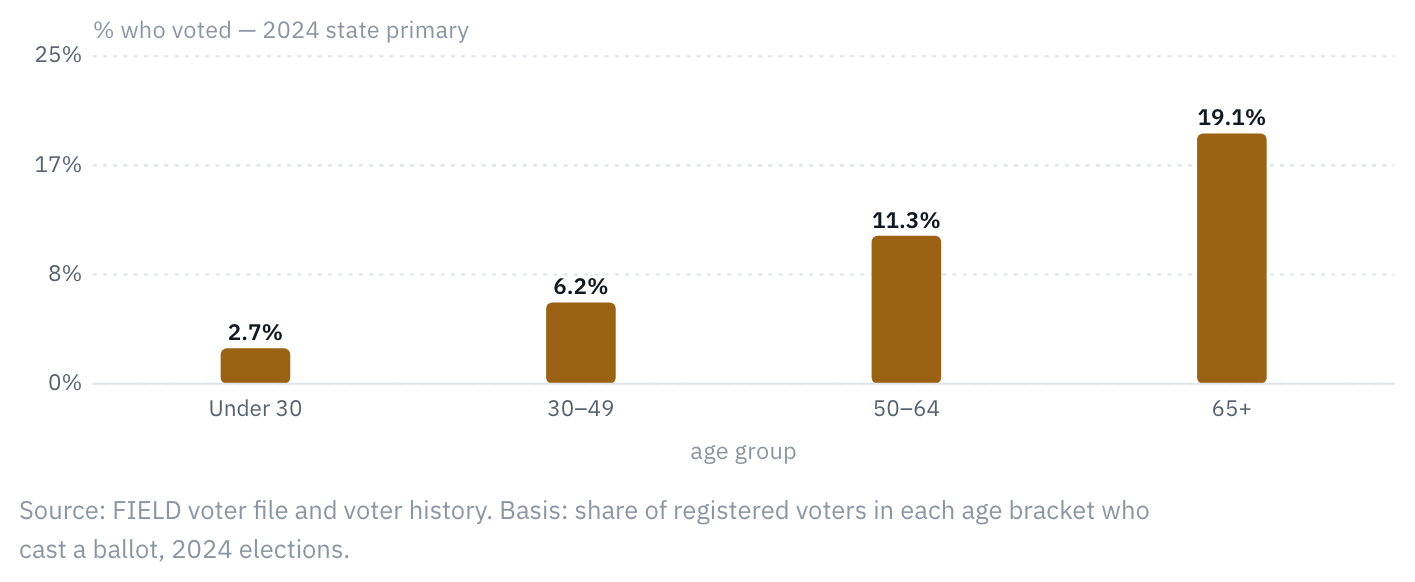
The older you are, the more likely you are to vote — and in primaries the gap is enormous.
Older voters vote 1.7x more often than young voters in General elections…
… and 7x more often in Primaries
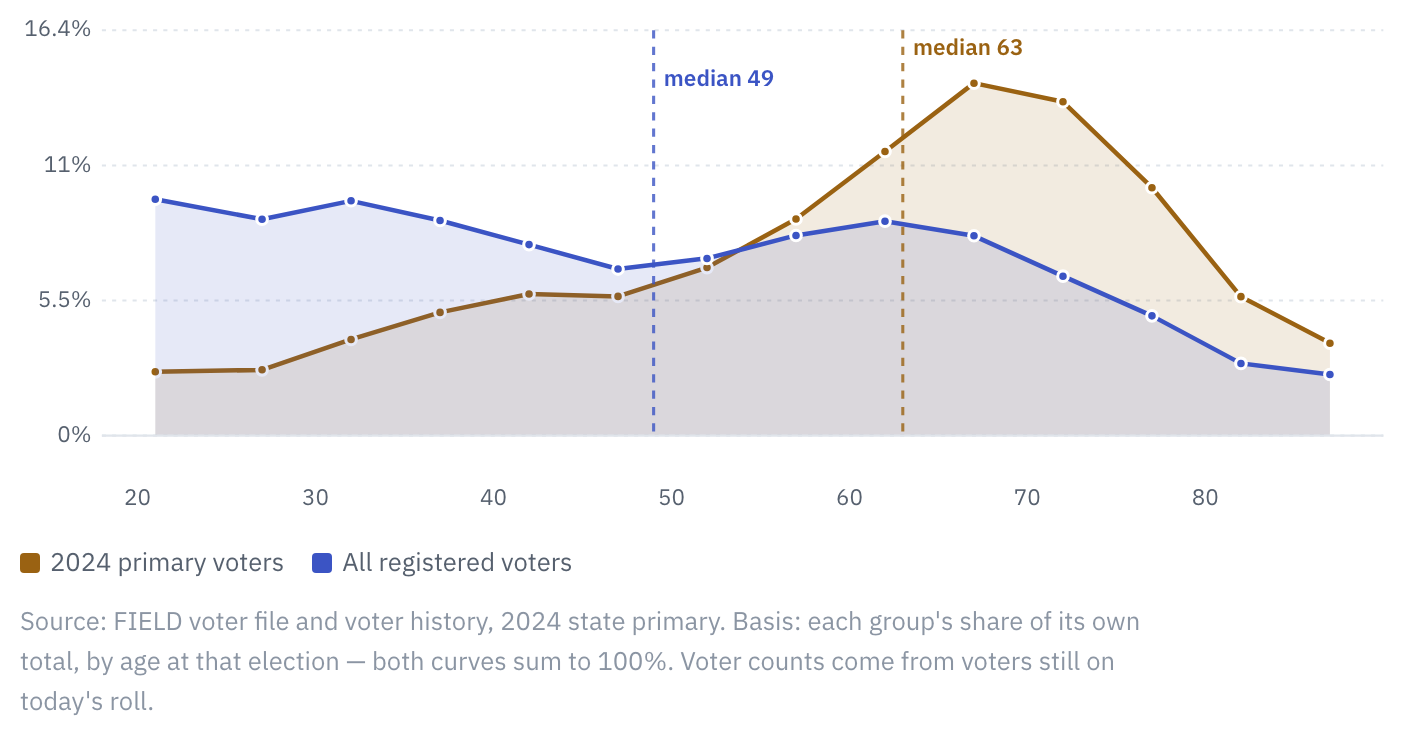
The typical primary voter is 14 years older than the typical registered voter.
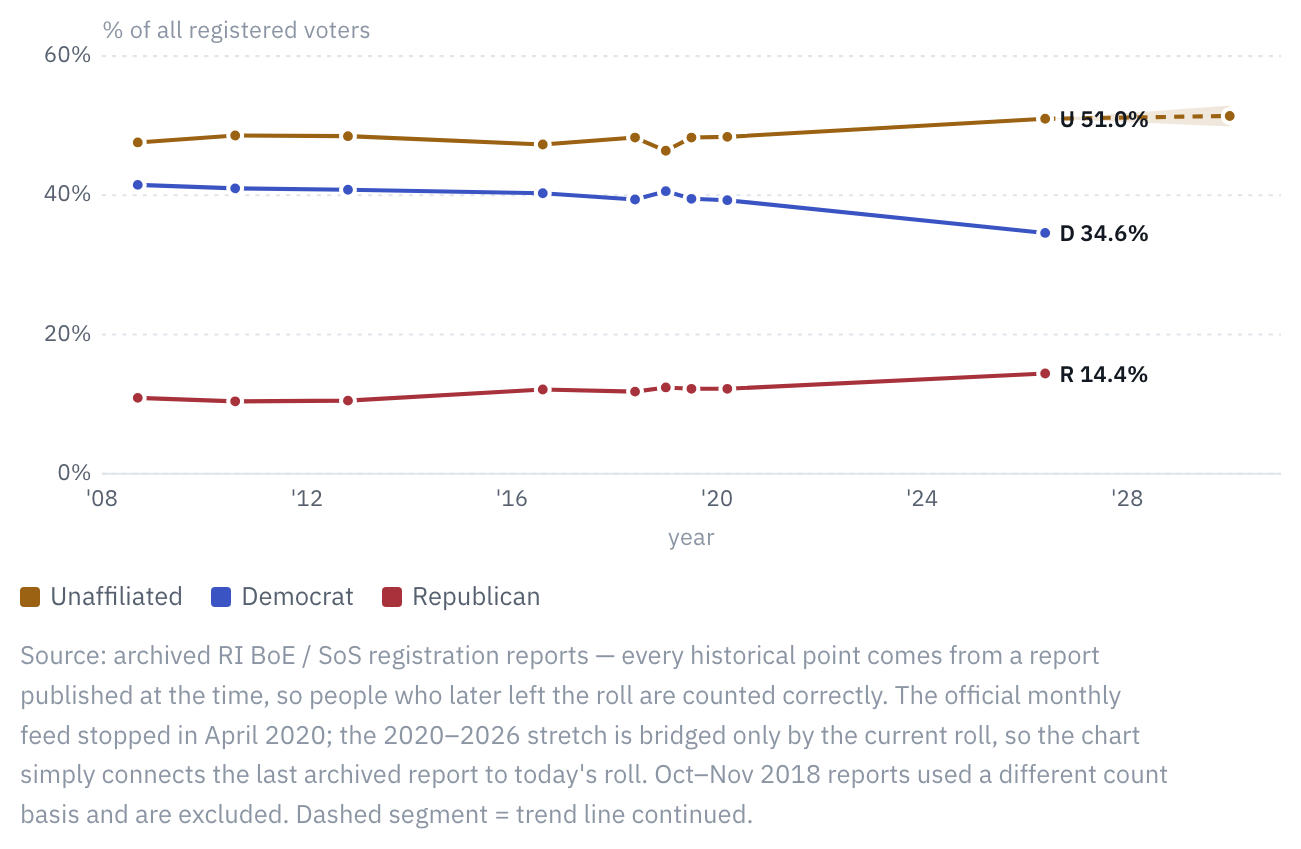
The majority of RI voters are not part of either party
Snapshot of the voter rolls as of 2026-08-13
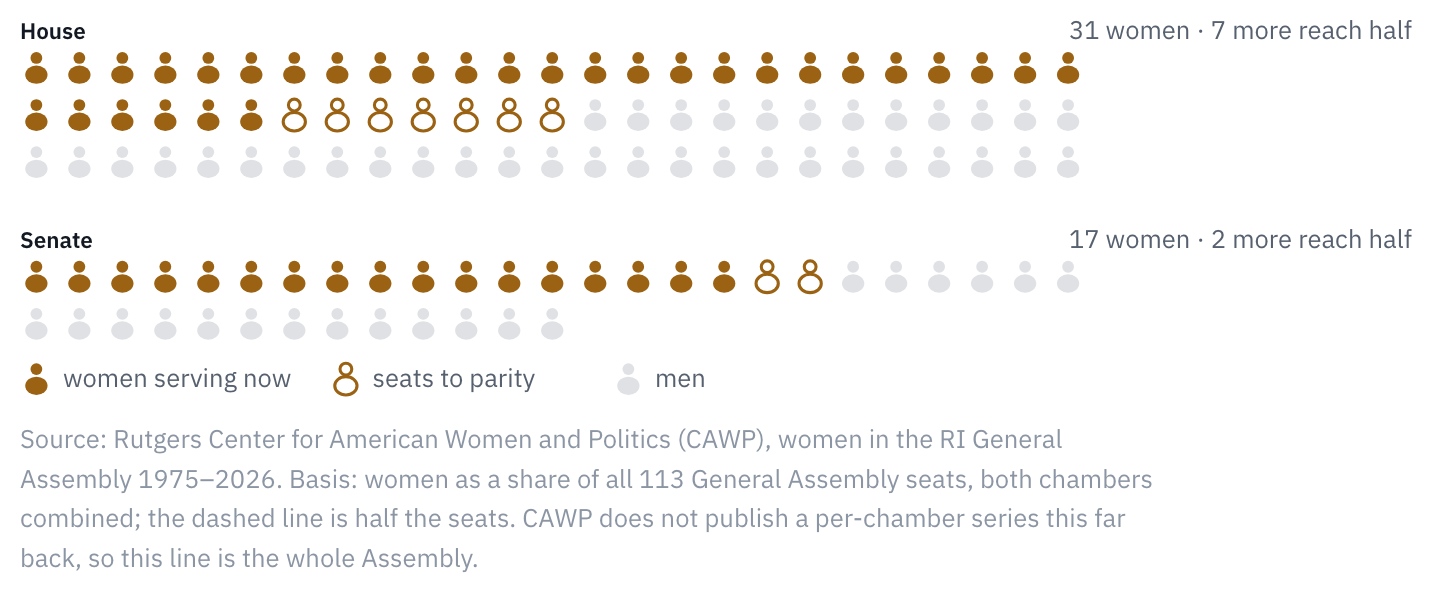
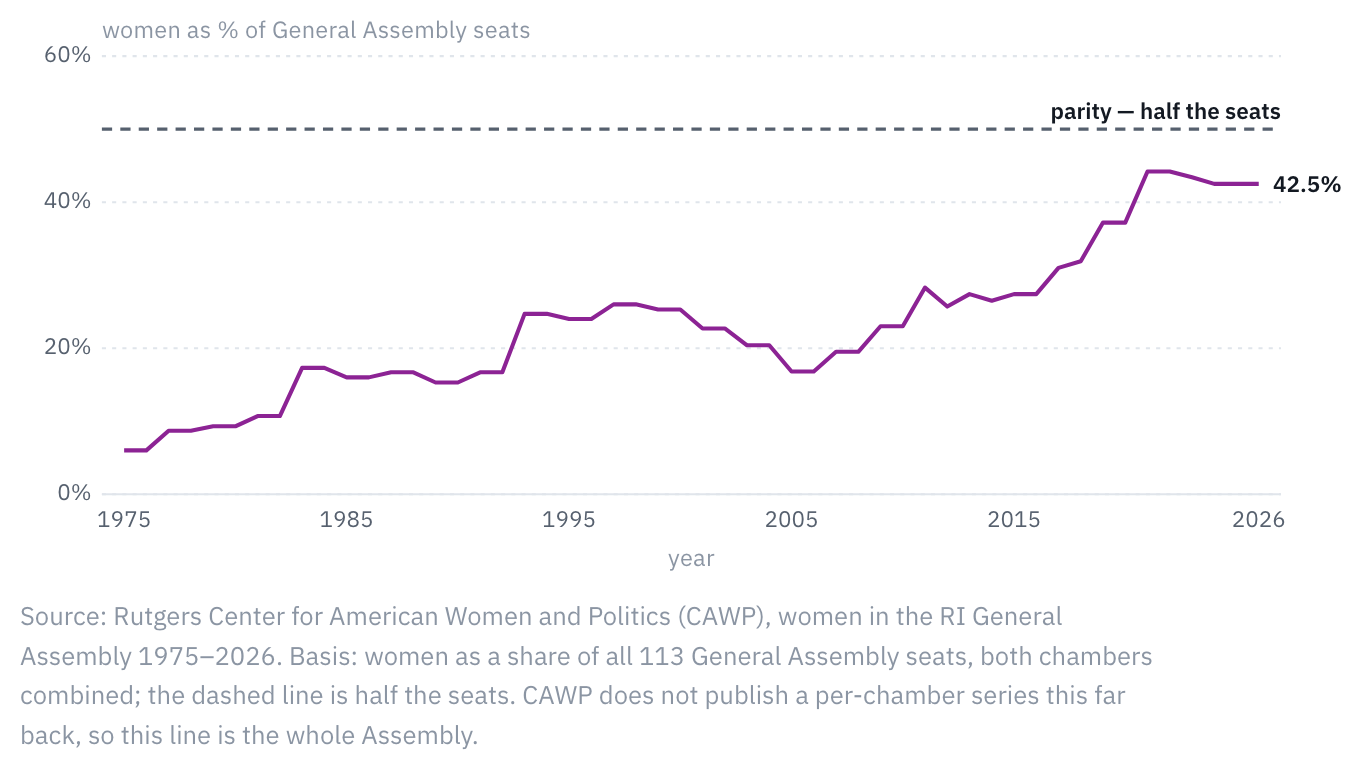
RI needs to elect 7 more women in the House
and 2 more in the Senate to reach gender parity
Most elections in Rhode Island are not competitive
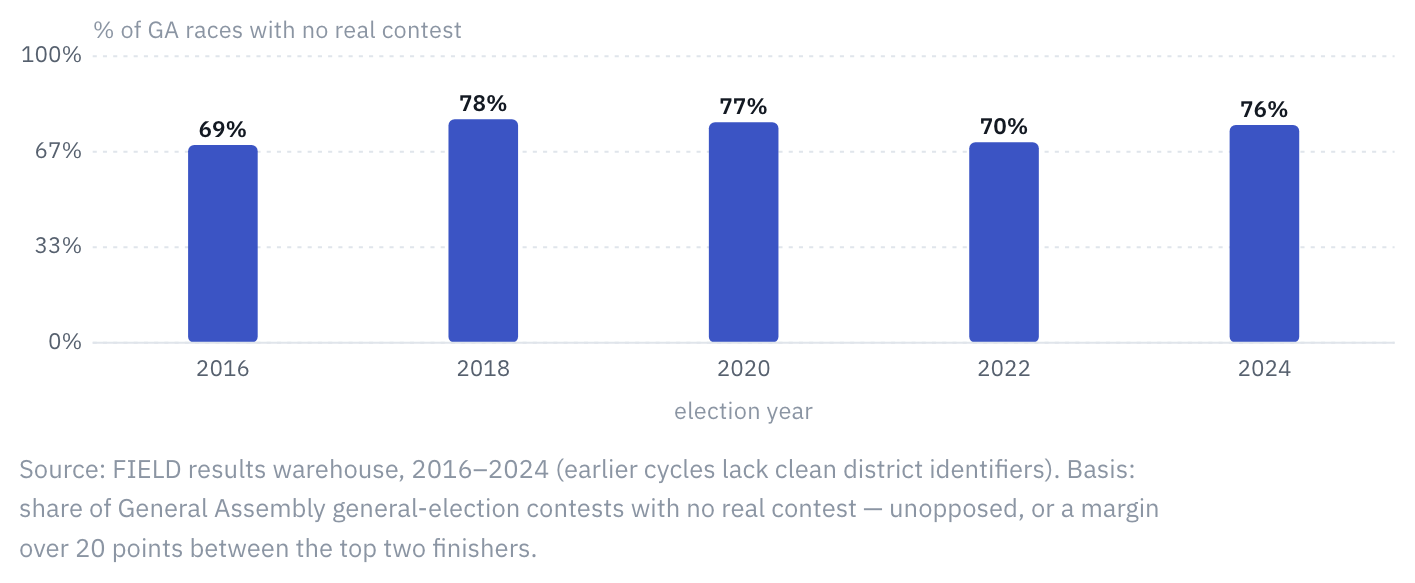
About 3 in 4 General Assembly races are effectively decided before the November election.
From 2016 to 2024, 69–78% of General Assembly general-election contests each cycle were either unopposed or won by more than 20 points. Most seats are settled in the primary — the election almost nobody votes in.
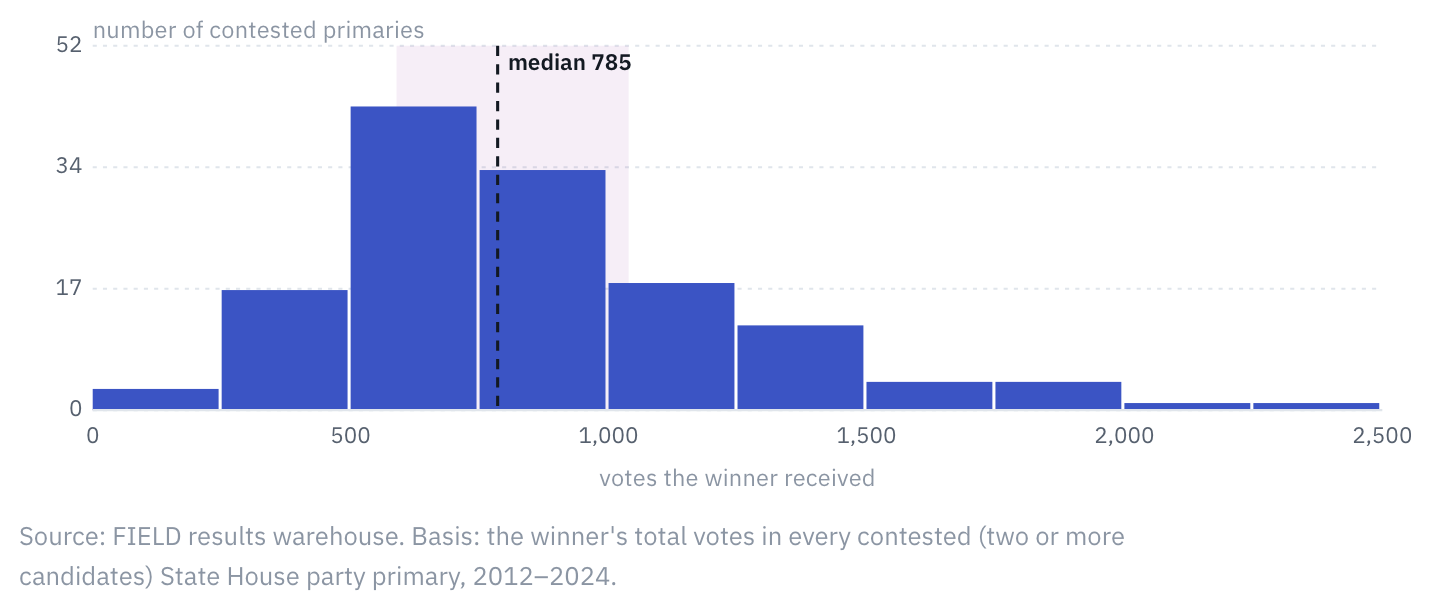
Winning a State House primary typically takes 600 to 1,000 votes.
Across all contested State House primaries from 2012–2024, the median winning total was 785 votes; half of all winners finished with between 589–1,039 votes.
The average member is in their mid-50s and has held the seat for roughly nine years or more.
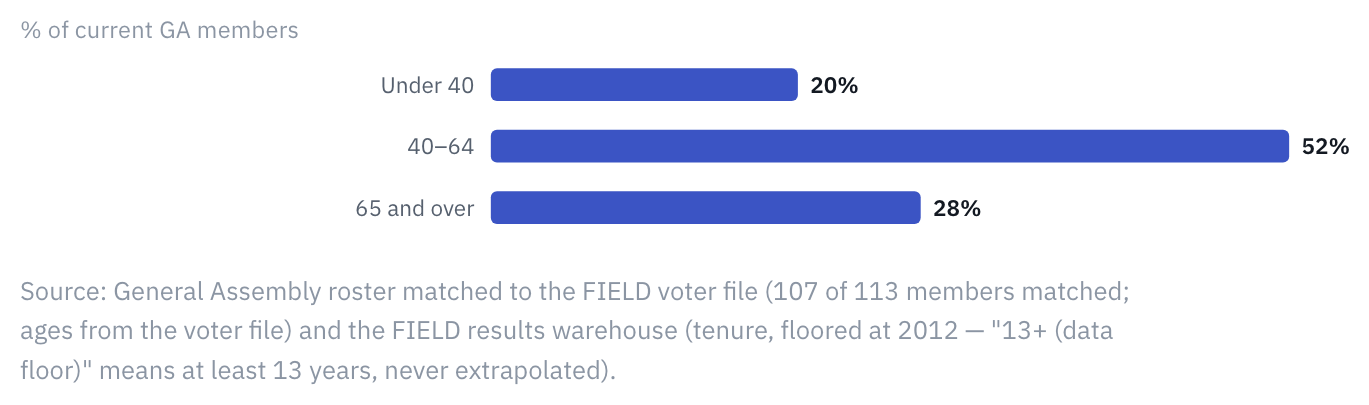
The average age is 54.8 (House 56, Senate 53); 28% of members are 65 or older and 20% are under 40.